
Breaking through the bottleneck of performance optimization!
How do you efficiently and accurately optimize the performance of 3D mobile games? At the Shenzhen Salon not long ago, senior Cocos technical expert Zilongshan analyzed the optimization bottleneck from the hardware perspective, helped everyone understand the root cause of performance problems from the bottom-up, and provided direction for performance optimization in actual development. Below is a shared excerpt.
As the quality requirements of 3D mobile games are getting higher and higher, the game screen performance is improving, and the need for performance optimization is becoming increasingly urgent. But mobile phone hardware platforms have their own unique characteristics – limited resources (limited CPU, GPU, and memory) and low power consumption, which constrain the design and implementation of hardware graphics pipelines and engine rendering pipelines.

As a game developer, it is essential to understand these hardware characteristics and pipeline characteristics. It can help us always have the Big Picture in mind when optimizing game performance in the future.
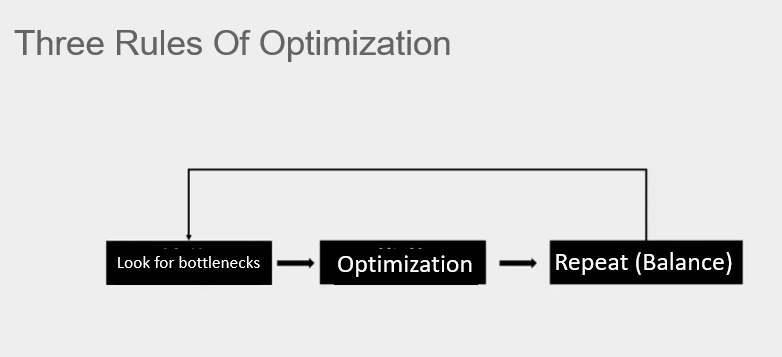
The most important thing to avoid when doing performance optimization is to just “do it” and have the frame rate is 25.
Performance optimization is the art of balance. We need to spend 20% of the effort to achieve 80% of the effect. Before optimization, you must first locate the performance bottleneck and optimize for the bottleneck to have a noticeable impact.
Mobile Platform Hardware Features
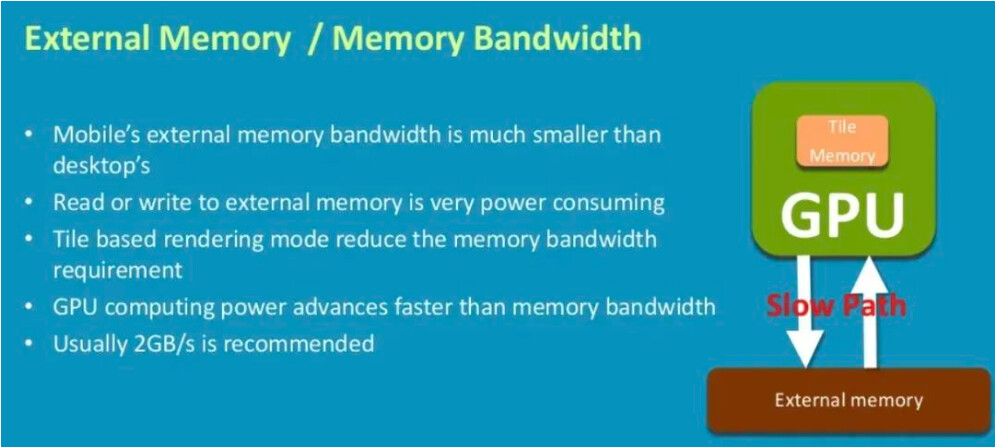
The hardware of the mobile platform is basically designed around “low power consumption” because the mobile device does not have infinite power like the PC side, with professional graphics cards and special heat sinks, compared to on-chip memory in the GPU of the mobile device. There’s usually very limited use. We say that the video memory of the mobile device is shared with the main memory, the battery capacity is also limited, and many mobile phones cannot be equipped with a professional radiator. Therefore, the mobile device has redesigned a new rendering pipeline - Tile-Based Rendering (TBR).
The following is the rendering pipeline architecture diagram of the desktop platform (Immediate Mode Rendering, IMR for short):

IMR is the rendering method used by PC and GPUs, which means that every time the rendering API is called, the graphics object will be drawn directly. Therefore, each time the color and depth of the object are rendered, the frame buffer and depth buffer must be read and written. This architectural design requires a lot of bandwidth and a dedicated bus and requires both L1 and L2 Caches to address bandwidth issues. However, the GPU size of the mobile device is very small, and the power consumption is very low, so it is impossible to support such a large bandwidth.
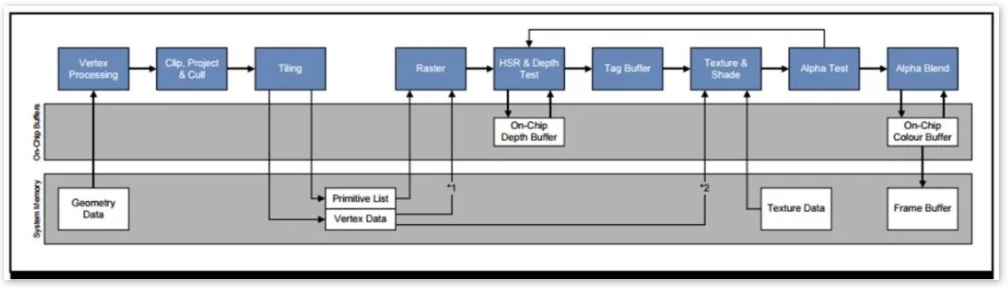
To reduce power consumption and maximize performance, the mobile terminal has designed TBR and TBDR (Tile-Based Deferred Rendering). The following is the architecture diagram of the TBR rendering pipeline for the mobile platform:

The specific implementation is: when rendering, the direct rendering object is no longer the current Frame Buffer and Depth Buffer (depth buffer) but a cache called tile buffer. Therefore, the read and write operations of the color/depth buffer in IMR (Immediate Mode Rendering) are changed to the read and write operations of the high-speed memory in the GPU. Both MSAA and Alpha blend are on On-chip memory, so it’s very efficient. In addition, the discussion about overdraw is also on the on-chip memory. There is no overdraw when the FrameBuffer data is written to the main memory. The HSR (Hidden Surface Remove) technology in TBDR rendering can ensure that there is no overdraw on the Tile Memory for opaque pixels.
The following figure is the rendering architecture diagram of TBDR:
For a more detailed introduction to TBR and TBDR, please refer to this article ( 渲染架构比较:IMR、TBR & TBDR - 知乎). (Editor Note: In Chinese, but a great article)
Stall at any stage in the rendering pipeline may become a bottleneck in the pipeline. Since the GPU is a highly parallelized hardware architecture, it is generally unlikely that these individual pipeline processing units will become the bottleneck (except for Pixel Shading). More bottlenecks may occur in the interaction stage between the pipeline and the main memory, as shown in the following figure:

Engine rendering pipeline
For the GPU rendering pipeline of the mobile device, hardware manufacturers have introduced the OpenGLES graphics API for GPU programming. Due to some limitations of OpenGLES, the latest graphics API provides more capabilities to manipulate low-level resources, which can further reduce pipeline state switching and power consumption such as Vulkan and Metal. The game engine uses these APIs to submit rendering data to the hardware for processing as efficiently as possible.

The CPU side is mainly responsible for preparing the rendering data and telling the GPU how to render, and telling the GPU how to render is much slower than the GPU actually rendering!
The optimization methods of the rendering engine are mainly two points: Culling and Batching and reducing the state switching of the pipeline through reasonable Sorting.
Why do we need to pull out Sorting separately here? Because in general, to optimize performance, we sort the opaque objects in front-to-back order so that we can use the depth-testing of the pipeline to discard unseen pixels. You can also use Early-Z (or depth prepass) techniques to remove these invisible pixels before Pixel Shading. However, in the TBDR architecture, since the hardware supports HSR, the sorting of opaque objects has become less important at this time, and the saved CPU cycles can be used for other things (such as physics or animation), optimization of sorting You can refer to this article ( Sorting Objects and Geometry on PowerVR Hardware - Imagination ).
Optimization bottleneck
With the previous knowledge understood, let’s take a deeper look at the three main bottlenecks affecting game performance: CPU, GPU, and bandwidth.
CPU bottleneck
Generally speaking, your game bottleneck can easily appear on the CPU side. First of all, you need to eliminate the possible logical bottlenecks in your game (physics, animation, AI, Update complex calculations, synchronous IO, GC, etc.). For these logical problems, you can use object pooling, framing, asynchronous IO, separate logical frames and rendering frames, use simple physical collisions instead of real physical simulations, and avoid complex operations being called repeatedly every frame. If you are using a scripting language, you need to avoid GC and put computationally intensive operations on the native layer.
General game engines will provide a concept of a scene tree. So try to use a flat scene tree structure to reduce the complexity of the scene tree (the required content can be loaded on demand).
The most significant impact on rendering performance is to reduce Draw Calls. The core point of reducing Draw Calls is Culling and Batching.
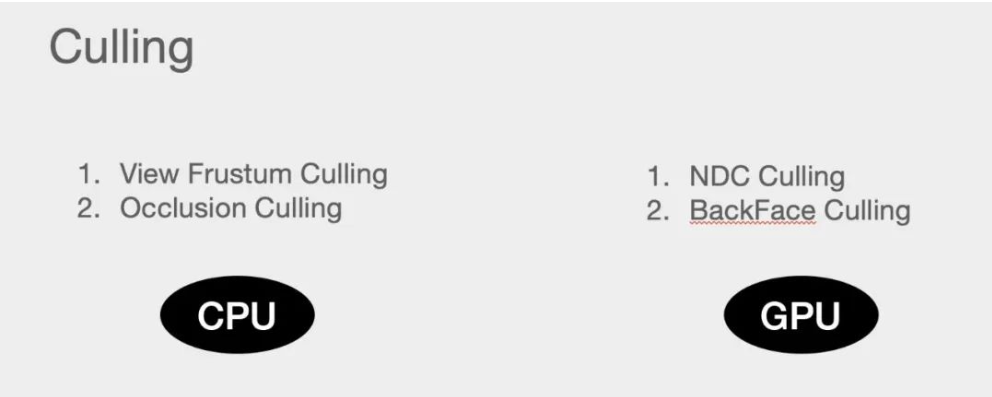
Culling is about drawing as little as possible. In addition, if the Culling system of the engine is not complete or there is a problem with the Culling settings, you need to capture the frame to confirm whether the element you want to Cull takes effect.
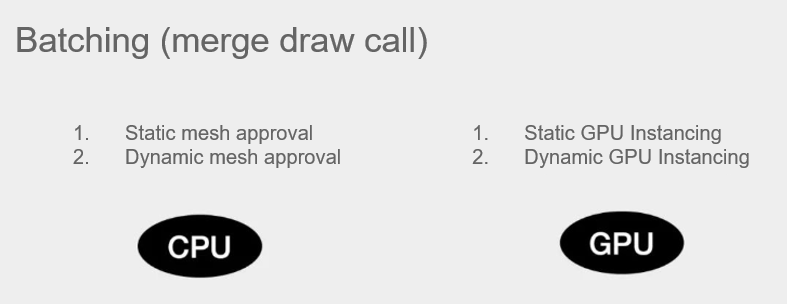
Batching is to draw as much content as possible each time you draw. If batching is done on the CPU side, most of the time is space for time, or the bottleneck is transferred to the CPU. And doing it on the GPU side is to maximize the use of the parallelism of the hardware, but it has many limitations.
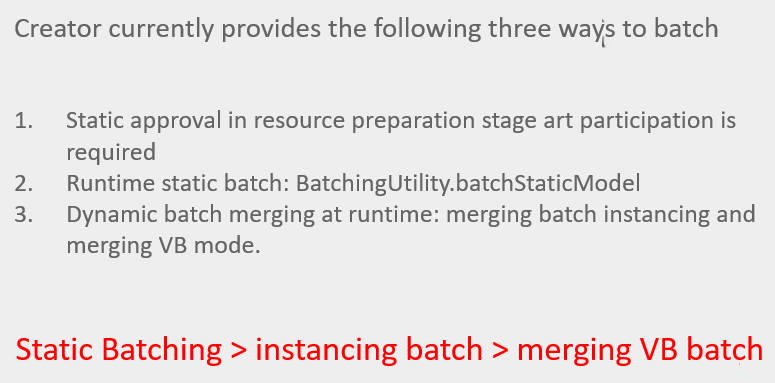
The following are Cocos Creator’s batch processing and its best practices:
GPU bottleneck
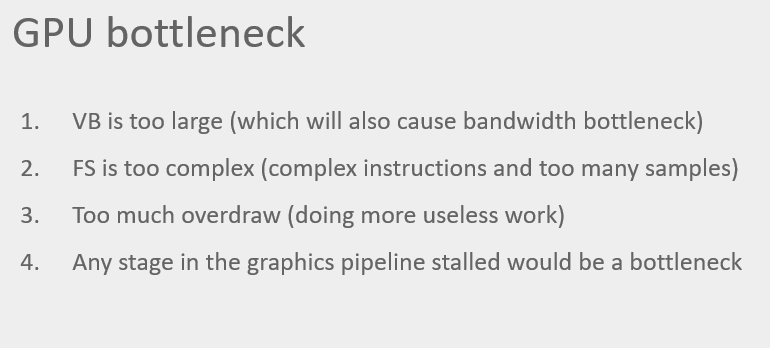
The bottleneck of the GPU, if the number of Draw Calls is reasonable, is generally mainly manifested in the complexity of the FS (Fragment Shader) instructions and high bandwidth occupation. But any other stage may also cause bottlenecks. For example, the number of your triangle faces exceeds a certain threshold. Generally, the mobile platform may be between 50w and 150w, which will quickly cause performance bottlenecks in the Tiling stage. Another point is that high overdraw will also cause the GPU to do a lot of useless work.
Bandwidth bottleneck
Due to hardware limitations, the bandwidth of mobile devices is very limited, and the reason why many deferred rendering technologies and post-processing technologies have not been widely used on mobile devices is also due to bandwidth limitations.
In general, using compressed textures can significantly reduce bandwidth usage. In addition, for PBR rendering, the textures used in PBR materials should be merged into one map as much as possible (for example, common specular maps, metalness maps, and shadow maps can be combined into one texture). If you need to use multiple RTs (Render Targets), limit the size and format of RTs as much as possible.
So how do you know if your program will be a bandwidth bottleneck? ARM recommended in 2019: 2GB/s.
If your game runs at 60 frames, then the available bandwidth per frame will be 21024/60 = 34M, assuming your GBuffer resolution is 1280 * 1080, then write the bandwidth of GBuffer (RGBA 4 bytes) once The size is: 12801080*4/1024/1024 = 5.2M, if there are three layers, it is 15.6M.
Considering that generally, your game will have overdraw, assuming that overdraw is more reasonable around 1.5. Such bandwidth consumption can account for 15.6 * 1.5 = 23.4 M. Considering that you’re also rendering things like scenes, UI, and characters, this easily exceeds the recommended bandwidth usage of 34M/s.
Performance optimization check steps
The author also provides a generalized performance bottleneck finding process for reference only:
- Use PerfDog to connect to the phone to see if it can run full frames.
- Check the CPU and GPU usage and keep it below 50% as much as possible.
- Use profiling tools to profile CPU overhead (time profiler for chrome and Xcode).
- Dynamically cull some elements in the game scene (such as scenes, characters, special effects, etc.) and observe the impact on frame rate, CPU, and GPU usage.
- Analyze whether the effect is a CPU bottleneck, a GPU bottleneck, or a bandwidth bottleneck.
- It is essential to make art resource specifications at the beginning of the project and provide tools to check and process resources automatically!!!
Performance Optimization Tips & Tricks
Recommended performance optimization tools
Performance optimization must rely on Profiling tools. This section will recommend some commonly used tools:
- RenderDoc: https://renderdoc.org .
- Xcode: Great for finding bottlenecks at the rendering pipeline level.
- Web: Chrome, inspector.js.
- Mali offline shader compiler: 有趣的阅读 - 如何量化分析Unity着色器的性能开销 - 知乎.
- Snapdragon profiler: A frame-grabbing tool that can count heavy draw calls and overdraws.
Tips
In the actual development process, it is impossible to go to the actual machine to capture frames and debug any minor problems. If there are some best practices or some performance checklists, it can help us locate performance problems faster. This section provides ten small tips for your reference:
- Optimize scenes and characters (LOD, Unlit, merge textures, reduce the number of cameras and lights, use batch and bake).
- Optimize UI (reduce overdraw), avoid system fonts, and use SDF fonts.
- Optimize shadows and lighting (avoid real-time lighting and real-time shadows, reduce shadow precision and size).
- Leaves, grass, etc. (use GPU instancing when possible).
- Optimize shader calculation, use textureLod, avoid alpha test and discard, and avoid three linear sampling and anisotropic sampling.
- In addition to UI, turn on mipmap (space for time) as much as possible.
- Optimize special effects, use POT textures as much as possible, reduce transparent areas, reduce overlays, and reduce particles.
- Optimize bandwidth: reduce post-processing, and use compressed textures in the appropriate format.
- If the bottleneck cannot be eliminated, it must be transferred (from CPU to GPU, computer shader, GPU skinning, Animation Bake, GPU particles, etc.).
- Cut art effects (or Fake performance).
Tricks
If there are Tips, there must be Tricks. These little tricks are learned from some old drivers in the industry. I believe many people have used them. Here are ten, for example.
- Do not set the Framebuffer according to the actual resolution of the screen.
- Multiple RTs can limit the update frequency and resolution of RTs.
- The Bake 3D scene is skybox, and low-end machines use skybox.
- Modify UI shader (multiplication of game color).
- The shader variable precision, except for position, uses the half format, mediump over highp.
- When playing full-screen effects or pop-ups, RT can be used to block the background.
- Use fake effects: fake shadows (patch shadows) and fake water (UV perturbation).
- The shader compiles and links, and loading large textures and large buf is placed at the beginning.
- Where the details are not prominent, reduce the material’s complexity, the texture’s accuracy, and the shader’s complexity.
- Use billboards wisely (faces and textures towards the camera to fake models).
Epilogue
Finally, performance optimization is a field that relies heavily on theory and experience, and the water is actually very deep and constantly evolving. At the end of this article, some of the latest performance optimization documents in the industry are provided, which are provided by chip manufacturers. I believe that it will benefit us to understand the root cause of performance problems. Much of the information in this article is also derived from these materials.