@jeffrey_ankrum creator 1.2 should work.
@jeffrey_ankrum i asked the creator guys, then changed engine since 1.1.2, and it uses 3.9, so can not work. Sorry about that, i don’t know the information. They said they will synchronize to latest cocos2d-x version in creator 1.3.
@zhangxm
may be you could give me a clue how to make some global exception handler, so I could see a stack trace of occuring exceptions in the xcode debug console?
Sometimes it’s very hard to track errors especially when it’s syntax error I don’t have a chance to connect to JSB debugger. I tried window.onerror = function() method, but it works not always.
Global exception in JS
Wherever the exception is happening you need to wrap it into a try catch section to catch it, I don’t know other ways
With Cocos2dx C++ we use crashalytics to get all crash details. Is there something similar to use for JS side of crashes with JSB build? I was also hoping to use window.onerror but that doesn’t work, so are there any other options for crash/exception logging with JSB?
Hi, it’s me again.
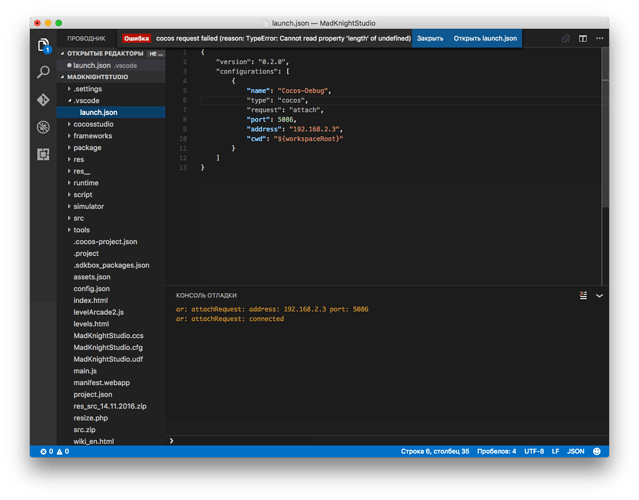
I’ve come back to idea of using VSCode and made a bit of research on “Cannot read property ‘length’ of undefined” problem when connecting with VSCode to JSB project.
This exception occurs in module cocosFXDebug.js (from cocos-debug.zip) at CocosDebugSession.prototype._getSources function. As I understand, the module makes a request to JSB server and doesn’t receive what it expects. It sends the request
        var request = {
            to: this._threadActor,
            type: 'sources'
        };
and receive the following object
{
	"from": "conn0.context1",
	"type": "newSource",
	"source": {
		"actor": "conn0.source4",
		"url": "/Users/hex/Library/Developer/CoreSimulator/Devices/[ommited path...]/MyProject-mobile.app/script/jsb_prepare.js",
		"isBlackBoxed": false,
		"isPrettyPrinted": false
	}
}
Then it tries to access ‘sources’ property which is not presented in response. As I understand, this property must contain a list of project JS modules.
Maybe this will give you a clue and you’ll be able to help me?
No special steps, all is followed by instructions given in this article. I’m using 3.10 engine version (I did patch it as described above). Here is my launch.json
{
    "version": "0.2.0",
    "configurations": [
        {
            "name": "Cocos-Debug",
            "type": "cocos",
            "request": "attach",
            "port": 5086,
            "address": "192.168.2.3",
            "cwd": "${workspaceRoot}"
        }
    ]
}
Next, I press Run button and get the error.
Oh, this feature is added since v3.11. I should mention it if i missed.
It’s ok. Can you tell me how to migrate to new engine version? Can’t find any official manual. Are 3.10 && latest one compatible?
Sorry, we don’t have doc about it. We just fixing bugs these versions, so i think there is not much breaking.
can you give some steps? like download new cocos bundle, unpack, prebuild libs, replace some folders in existing project?
I think you can just replace the whole engine.
I have created a new project and run it in web
cocos run -p web.
I have downloaded the cocos2d extension for vscode and placed it into the exact folder.
Now when I click on debug inside of vscode , it is giving me an error :
ar: attachRequest: address: localhost port: 5086
ar: attachRequest: retry socket.connect
what is wrong with this ?
@ysrikanth2011 what’s your engine version? Did you test on windows or Mac OS X? What’s the OS version?
I have the same error as @ysrikanth2011 on Windows. I’m writing mainly in js in cocos creator and I need to bind a C++ function can you give me any advice?
I am using Cocos2d-JS v3.14 on windows OS and VSCode version is 1.8.1 .

