
CocosCreator + Chrome Utility Plugin
Spector.js Introduction
Spector.js is a debugging tool for WebGL. It can help developers understand what happens in the WebGL context. It will display the internals of each frame, and tell what texture is rendering with each draw call.
For example, we built a new Hello World project with Cocos Creator v2.1.2
When the project is previewed in Chrome, you can see that:

Next, we can click the button at the top right of Chrome to open Spector:
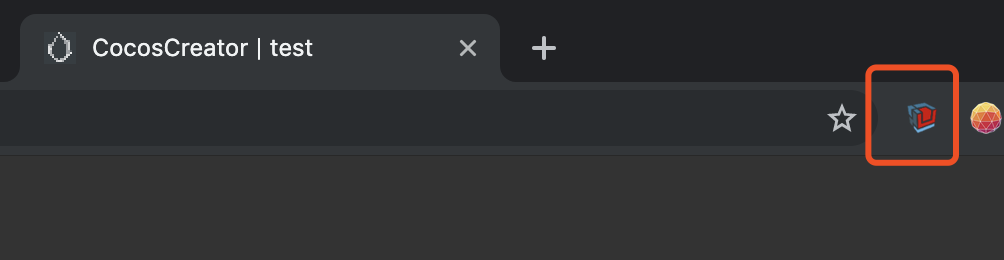
A green icon now shows we are using Spector:

Click the green button to pop up the interface
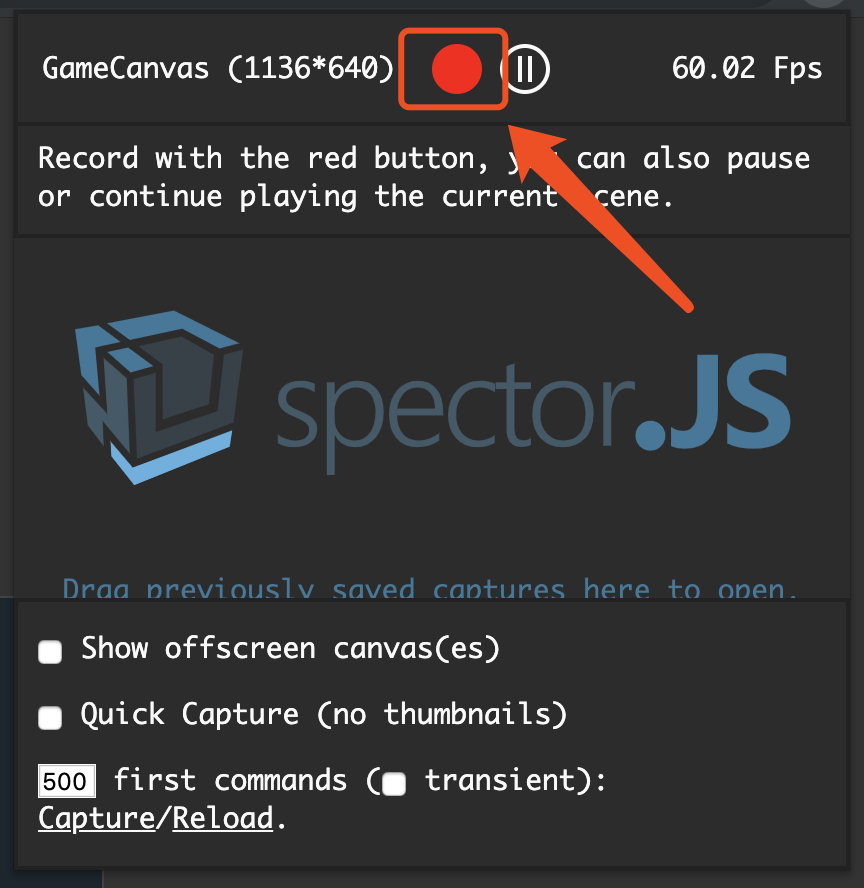
Now, we can see the WebGL information of the current frame of our project
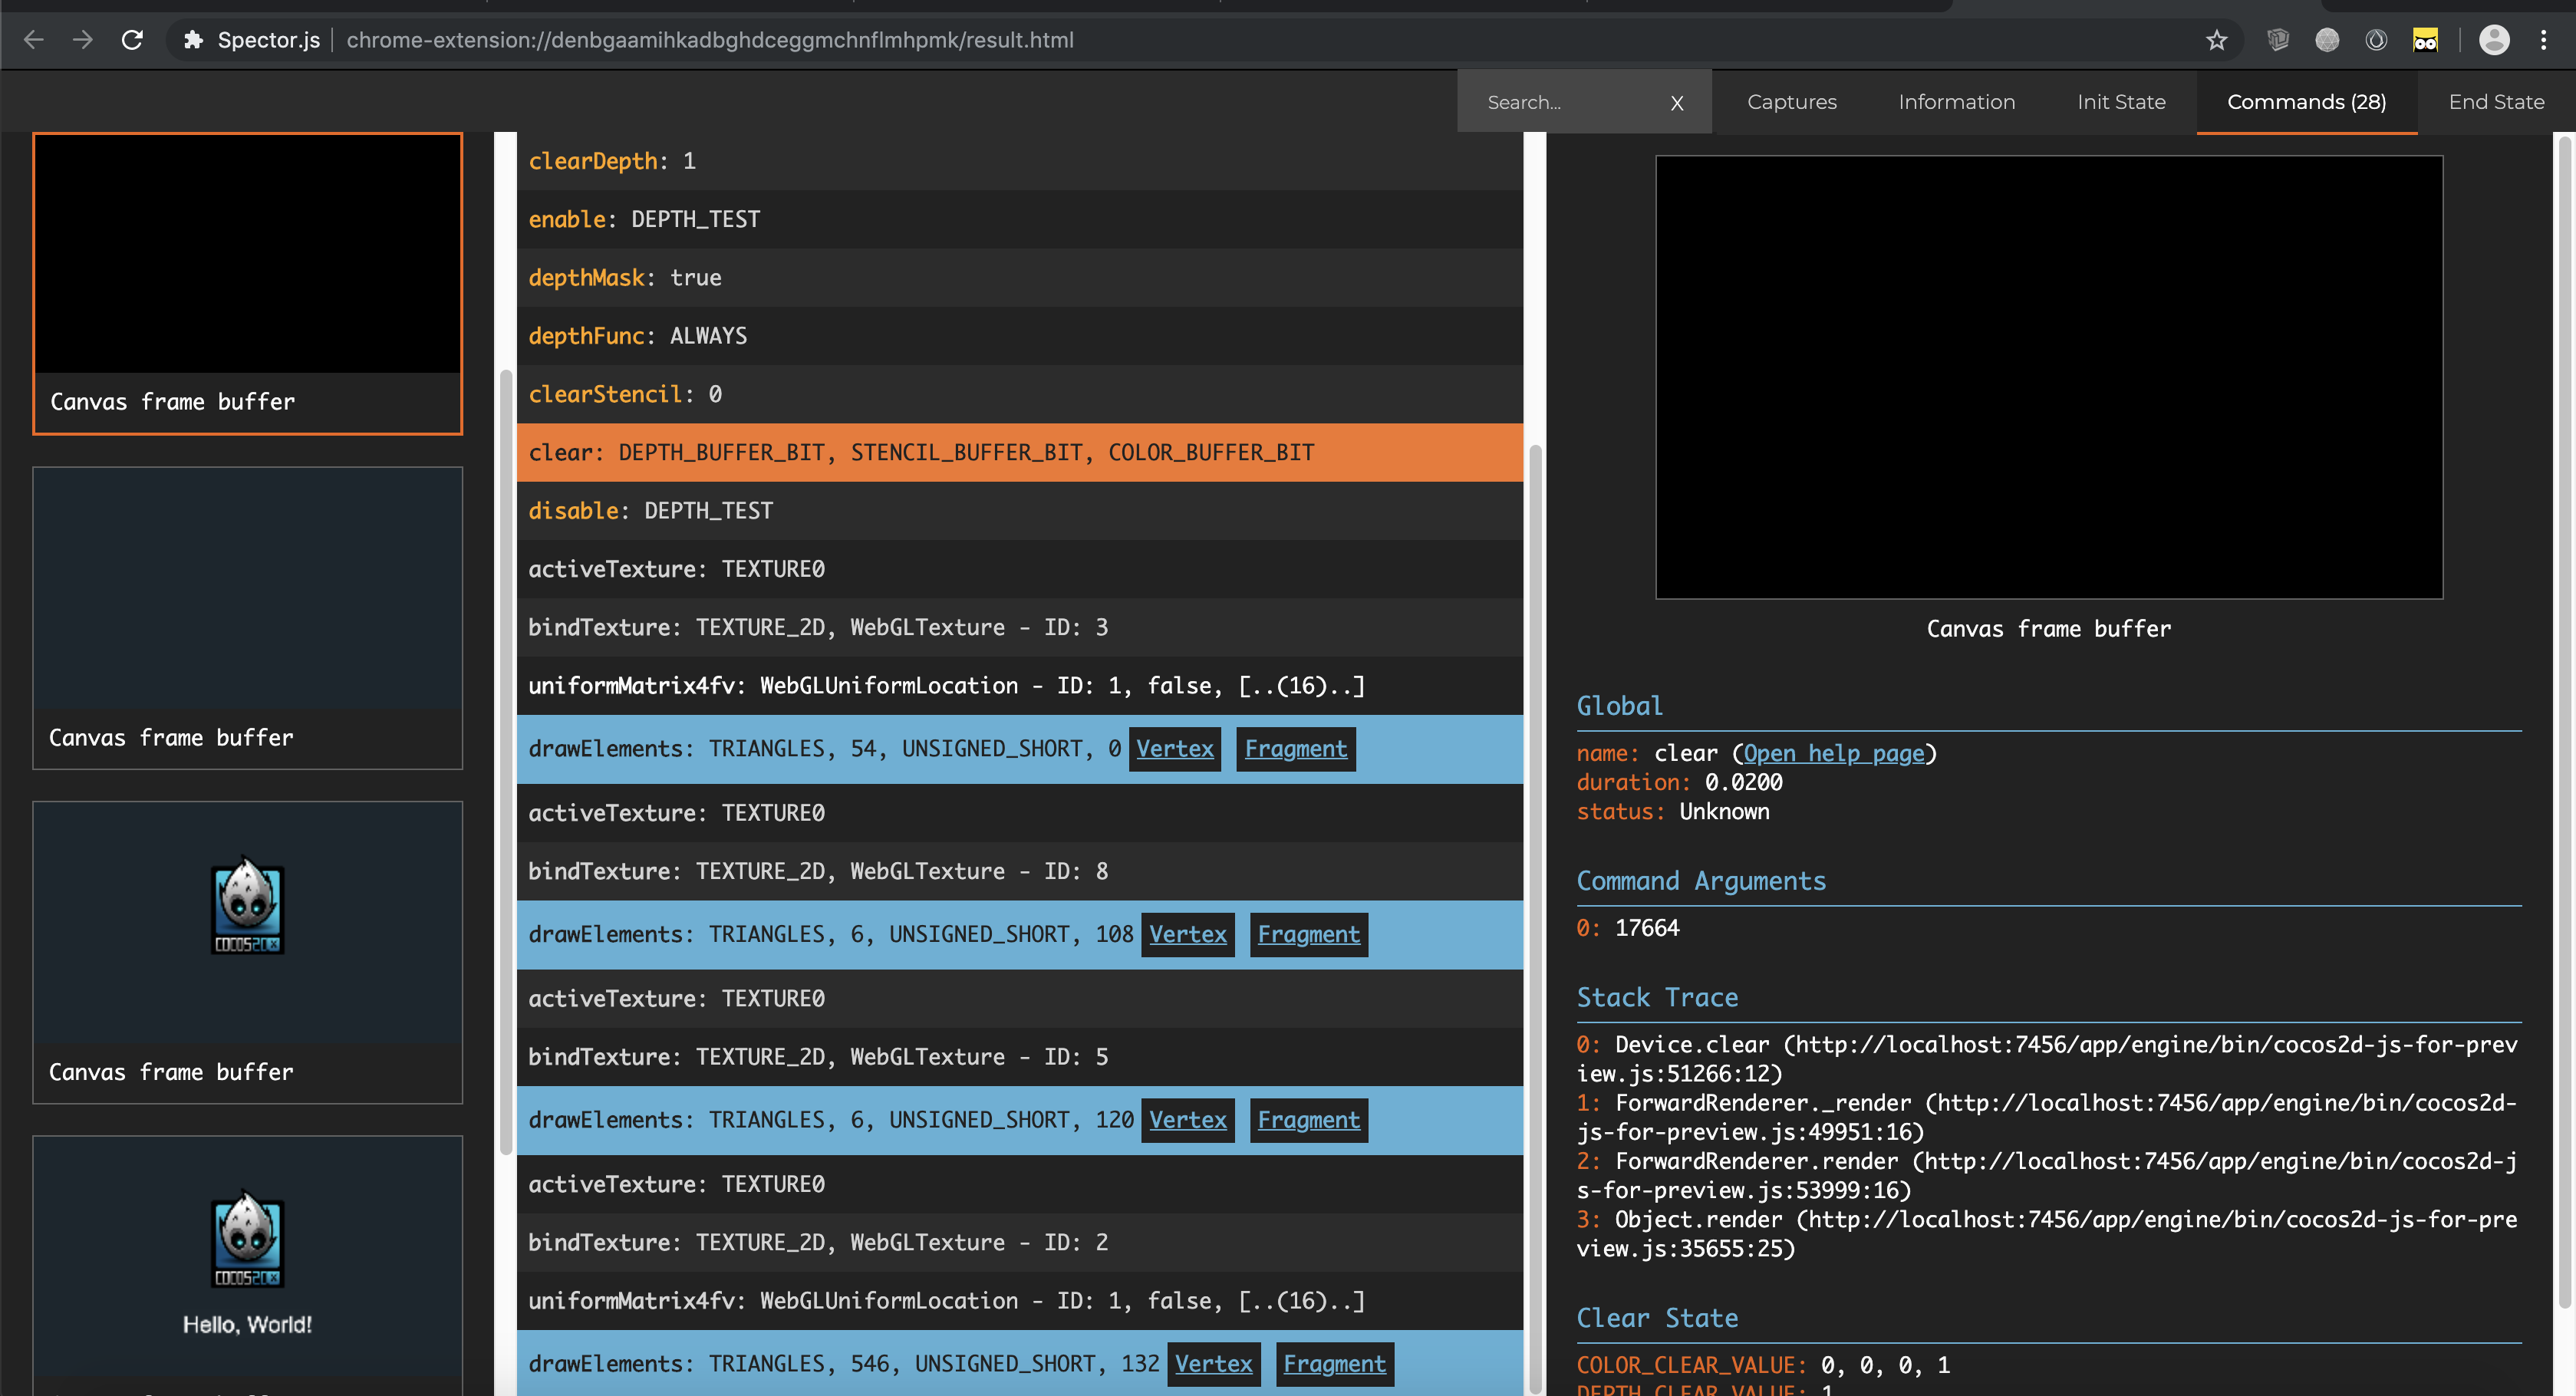
The left column is the display after each GL instruction invoked.
The middle column is each GL commands that we executed.
The right column details of each GL command.
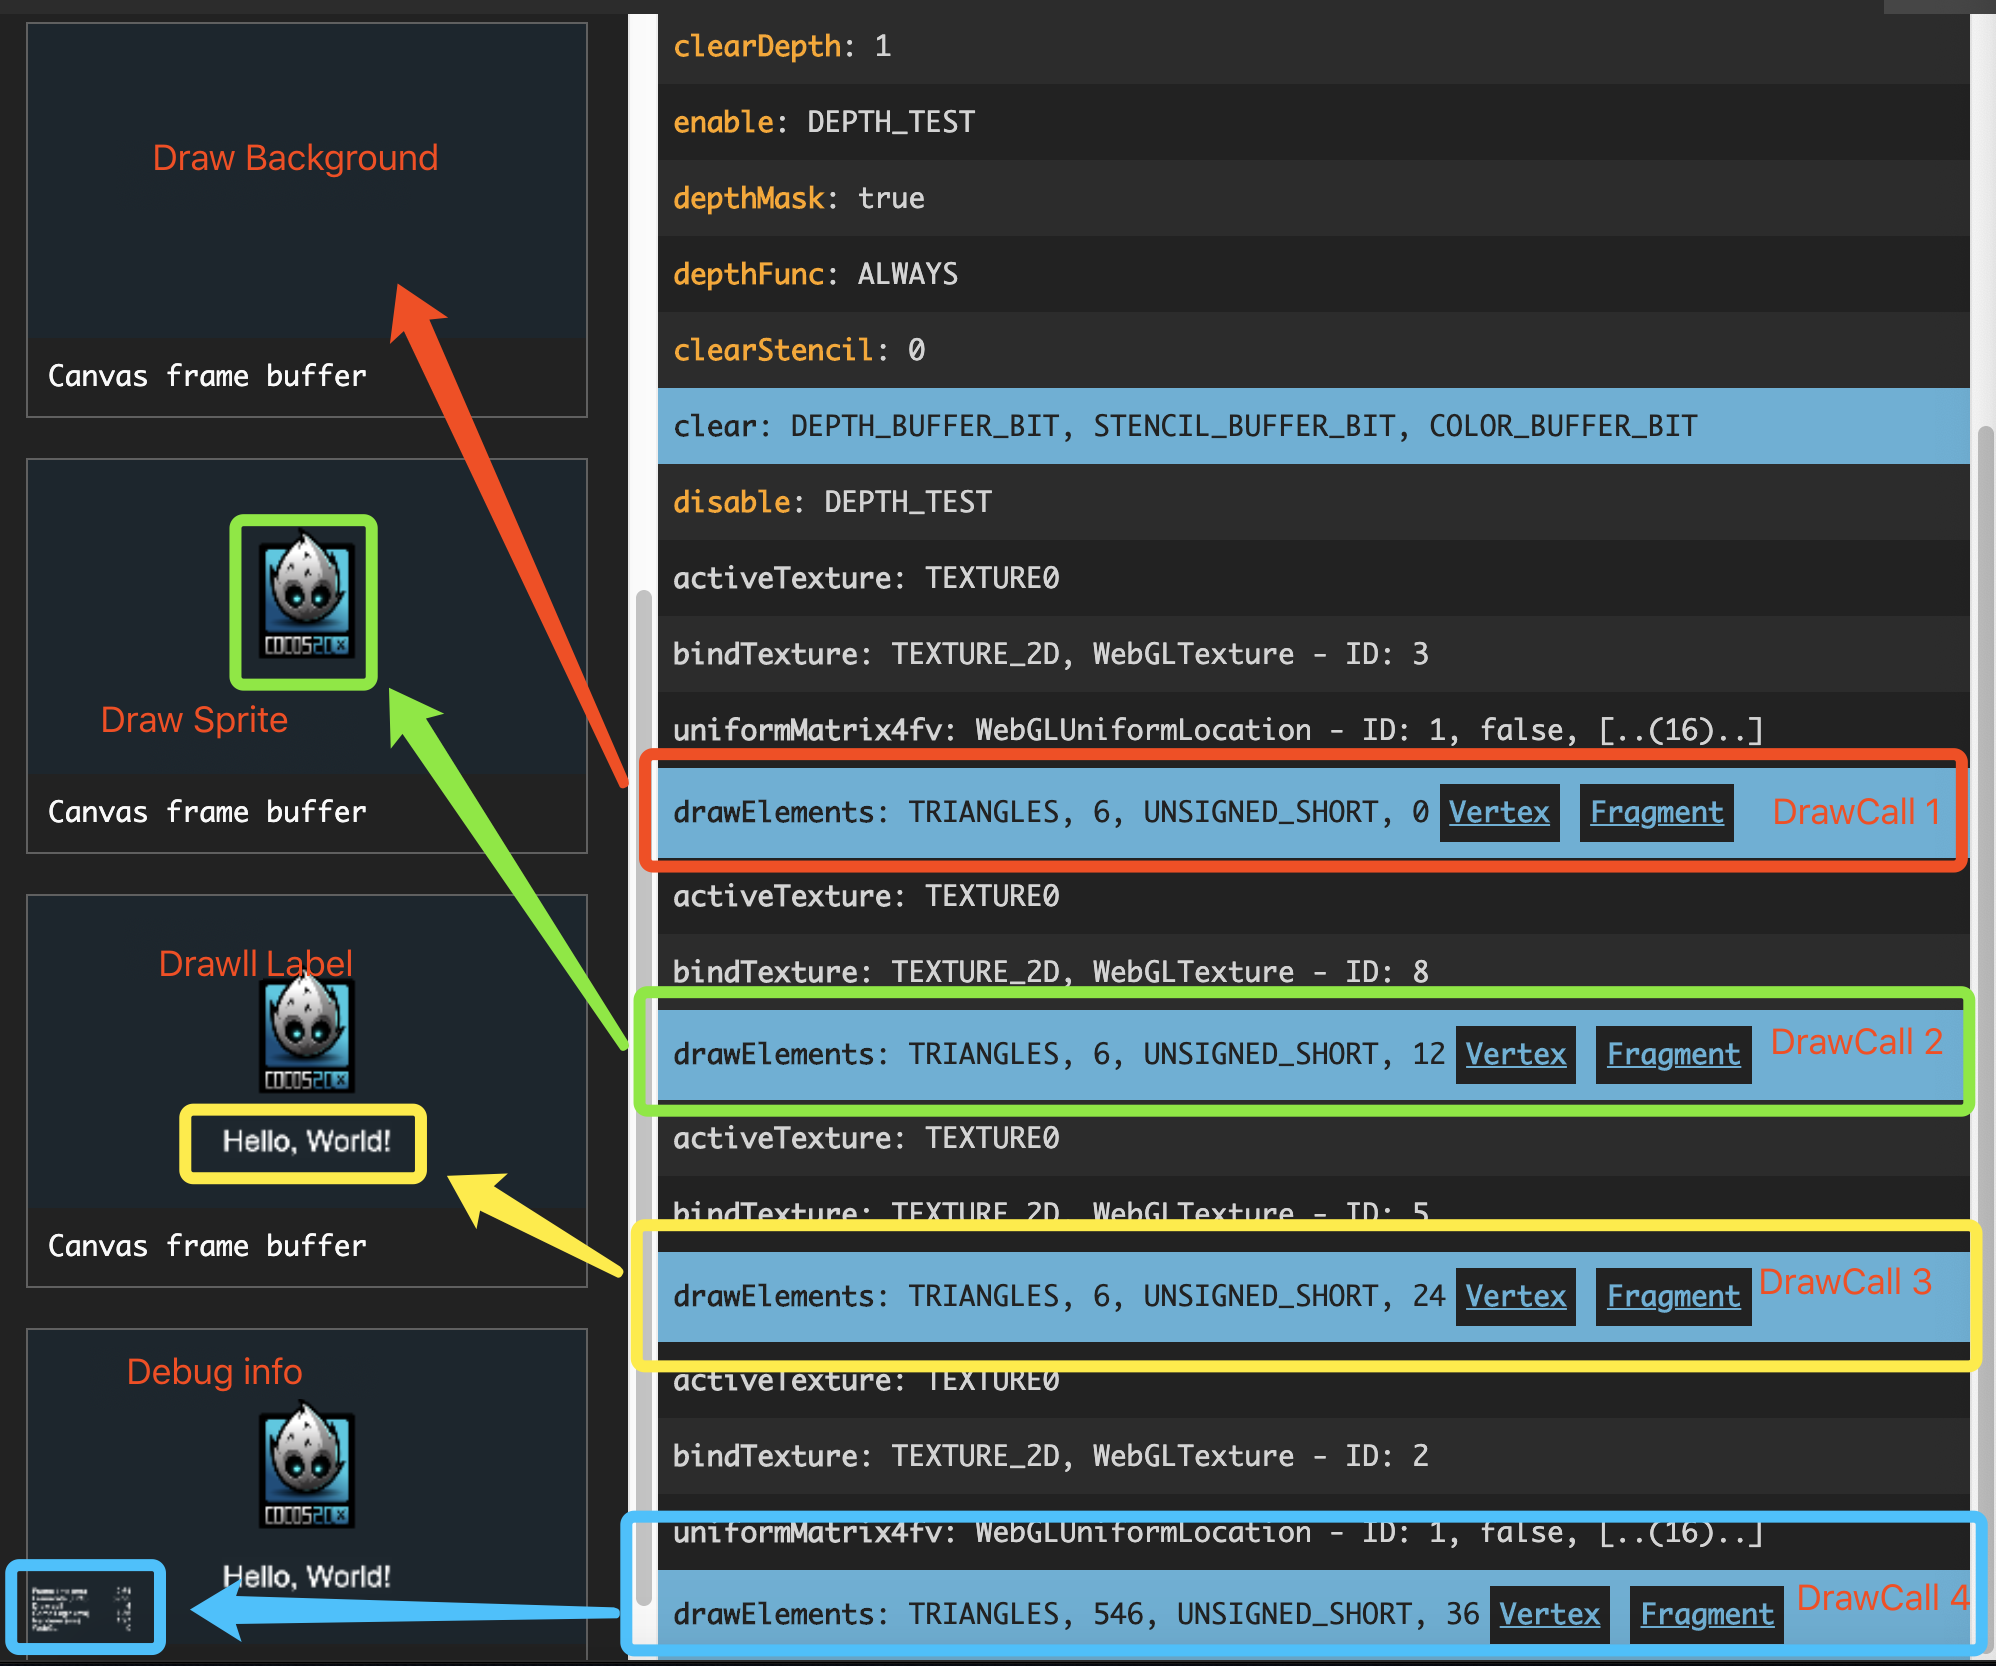
You can see what is drawn in each draw call.
It is also possible to check out the details of shaders with each draw call by clicking the button as follows:
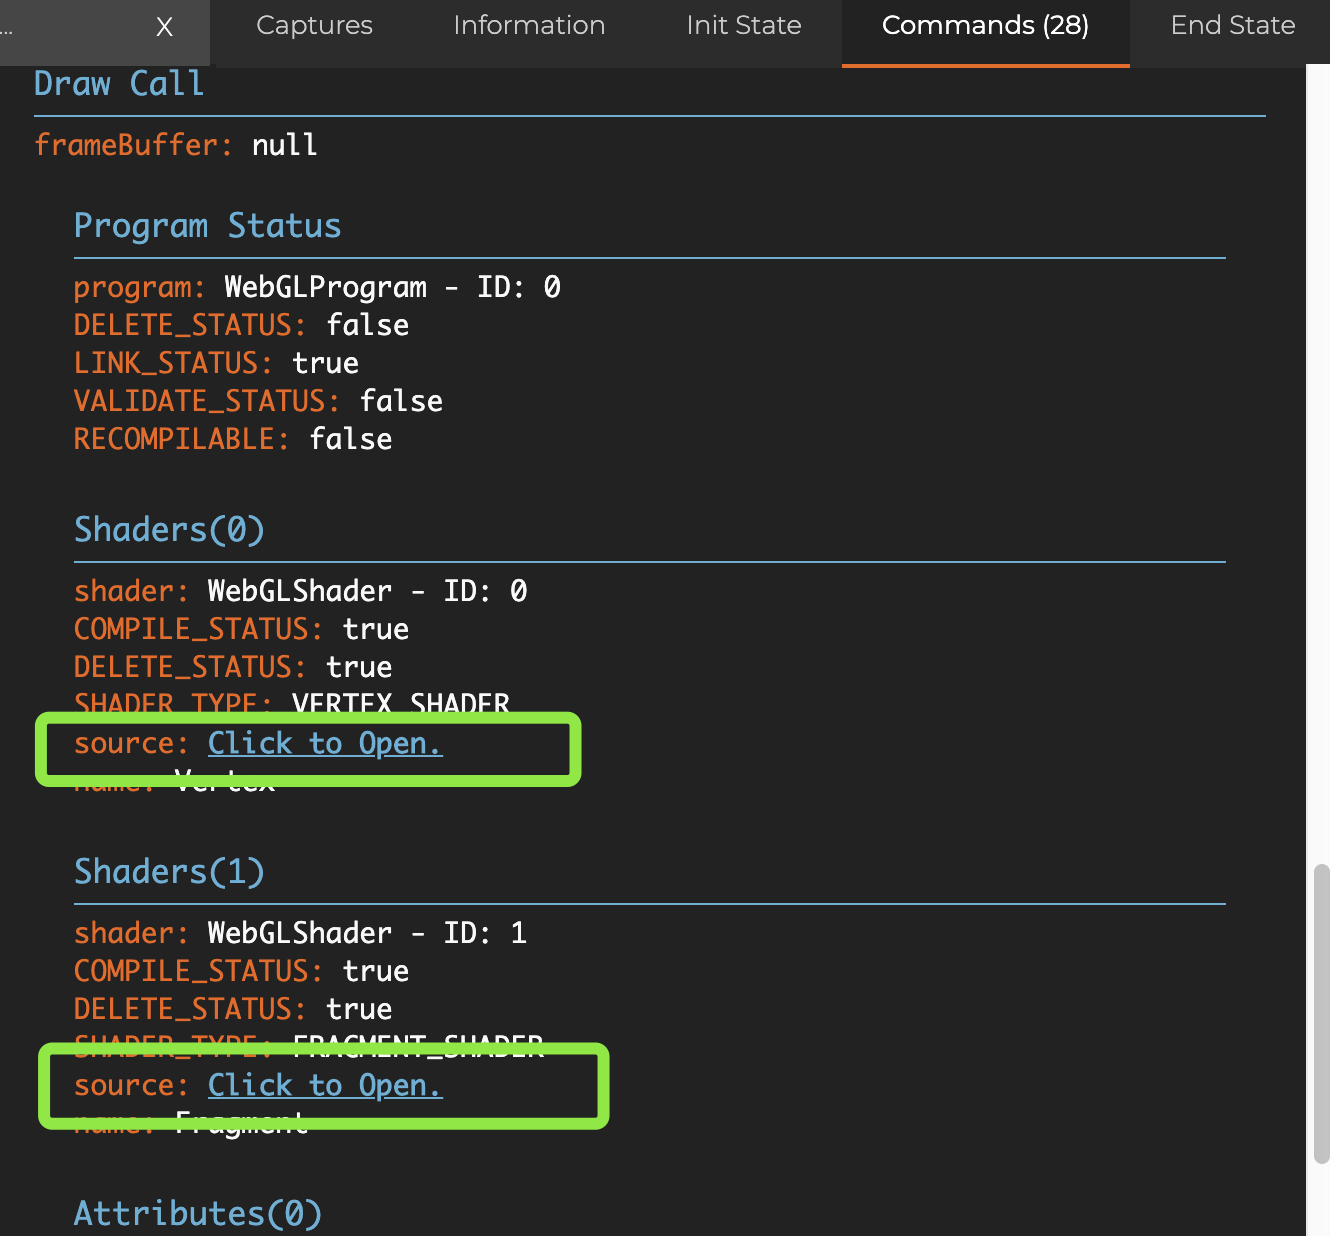

This is very useful!
How to use Spector with development
When we use the dynamicAtlas feature, we can check out the details of each draw call, and find out which render component has broken batching.
Knowing which render component breaks batching, we can follow the thread, and try to find why it breaks batching. Is it because of the difference in Materials (Shaders) or because of the difference between groups? Or other reasons?
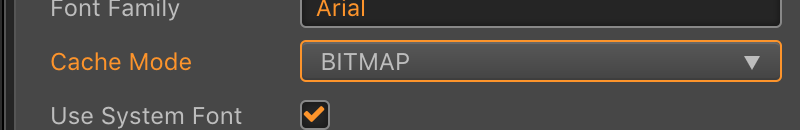
For example, we changed the CacheMode of the Label component to BITMAP mode in the Hello World project.
Now, let’s take a look at the draw call:
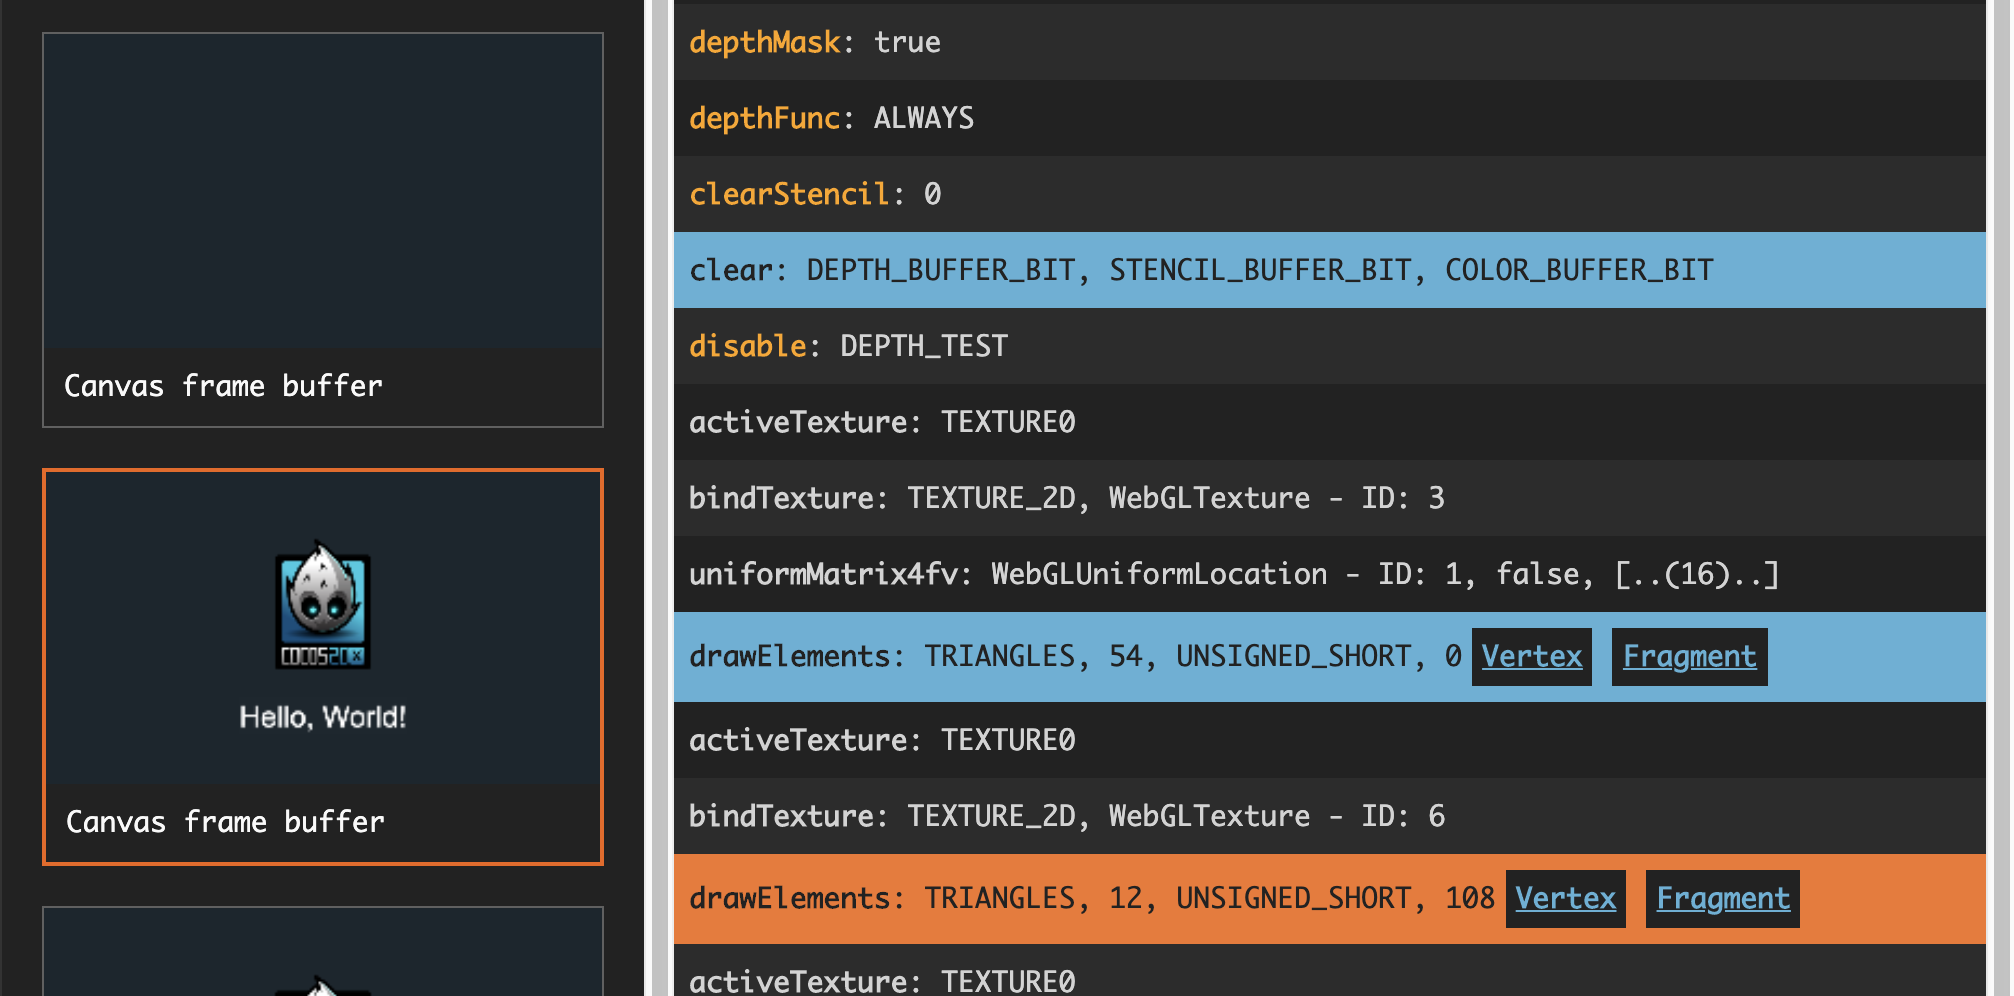
The Label and Sprite are drawn in one draw call, then are batched.
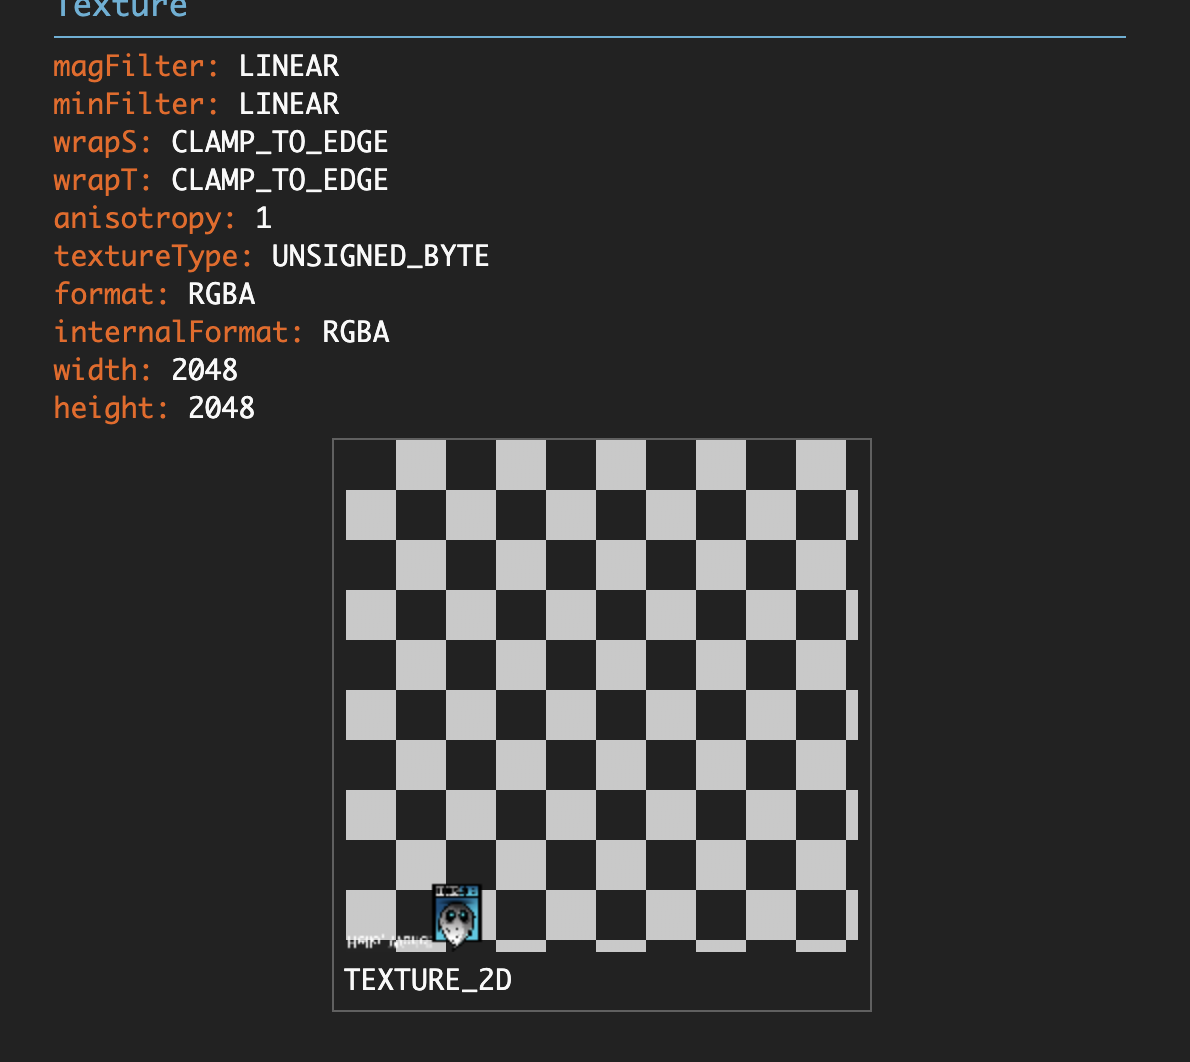
In the right column, the textures used by Label and Sprite were merged to a dynamic atlas, and now all are using the same texture.
With this information, we can make further optimizations of draw call. First, focus on the background node. The texture being used is: singlecolor.png, and has a size is 2 x 2. The dynamic atlas can not batch it, because of the small size. Knowing this, we can change the size to 32 x 32, and now the texture can be batched.
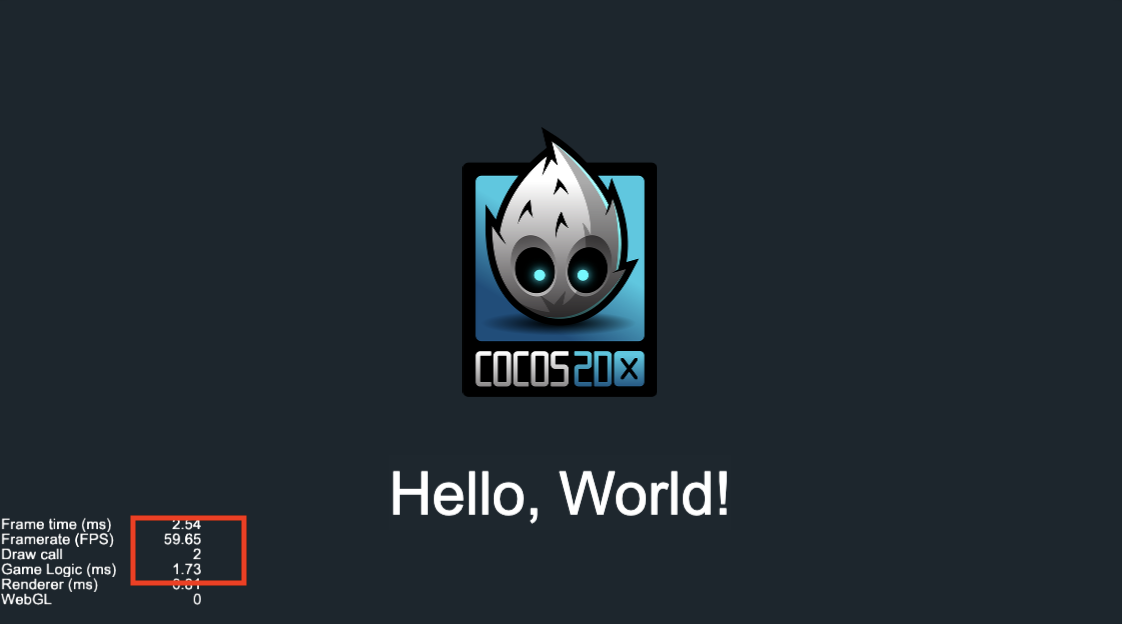
From this, we can see the draw call will be optimized to 2. One is the debugger information, displayed in the bottom left, we don’t need to care about this call.
That is how we use Spector to help us optimize rendering and find problems.
WebGL Insight

WebGL Insight is also a debugging tool for WebGL, but it has fewer features and less convenient to use than Spector. It has some of the same features as Google Dev Tools, but is not as easy to use. If appropriate, you can download it and try.
Cocos Creator Devtool
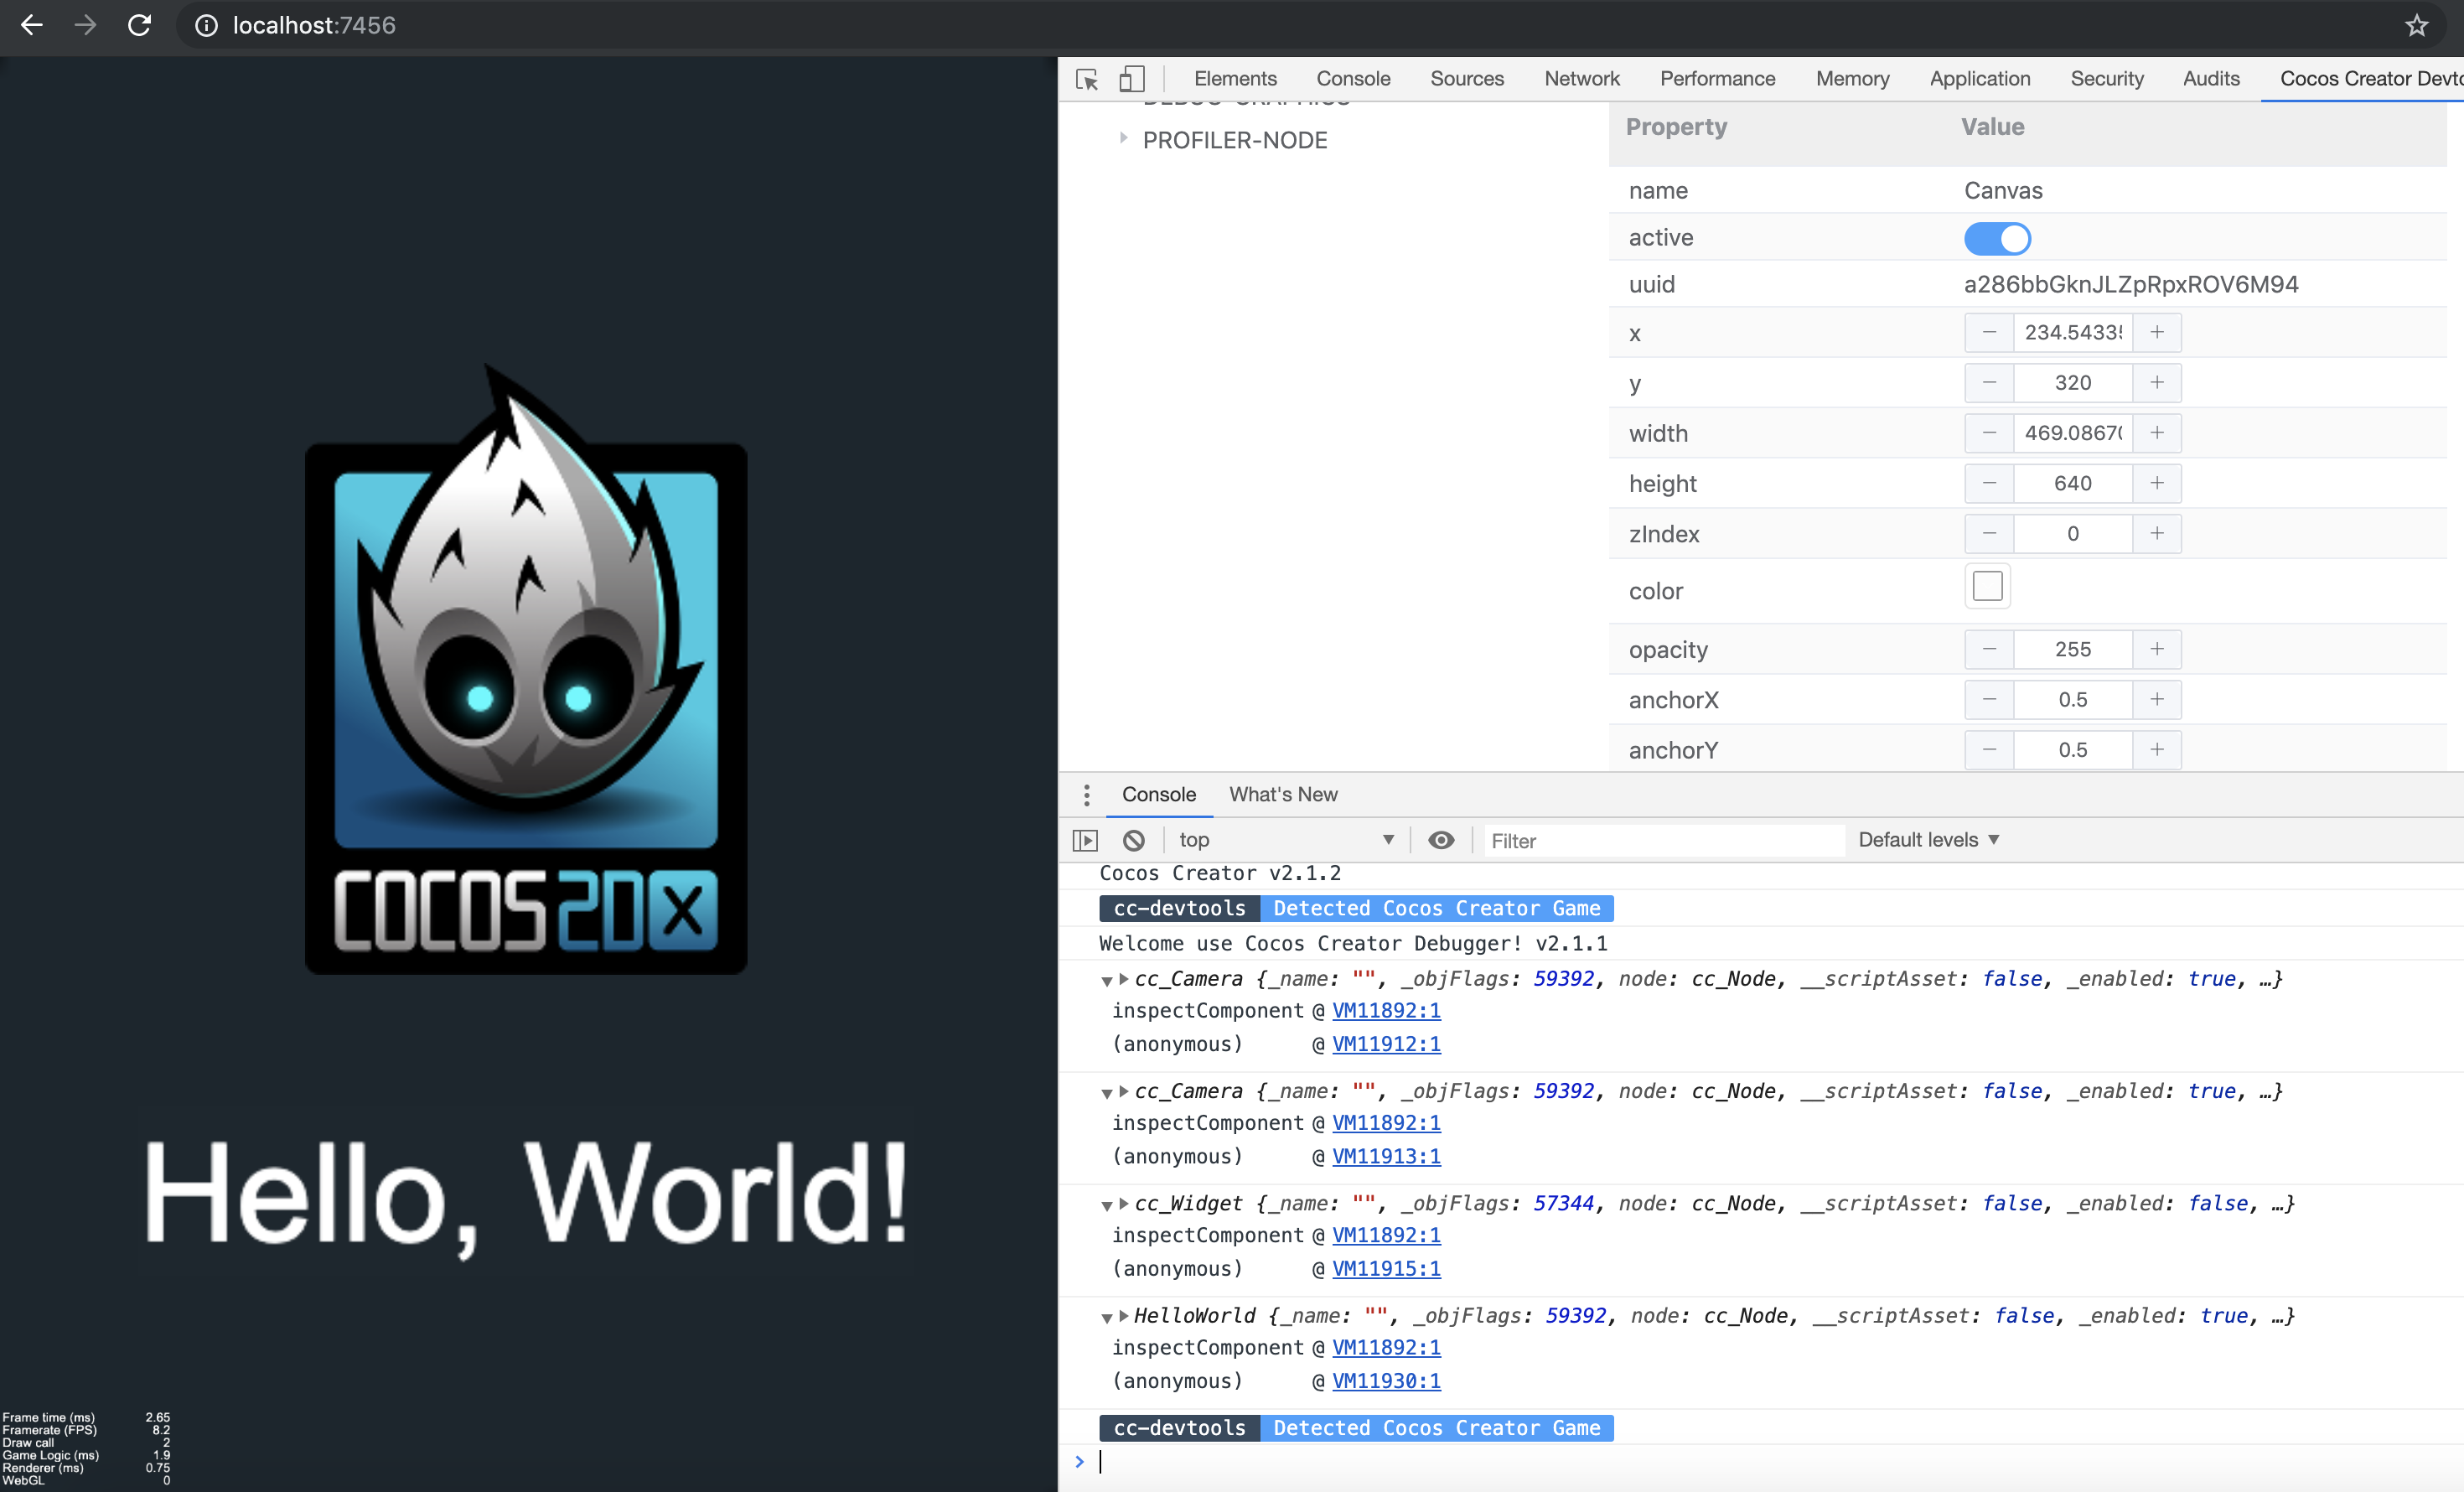
Cocos Creator Devtool can help to check the information for a Node during previewing and can also change the properties of a Node during running. Debugging complex UI interfaces becomes much easier. However, a drawback is that properties of custom components cannot be modified, and currently this tool only supports components that are provided by the engine. It can also make some debugger code unnecessary and prints information of a Node in the console without pausing.
Cocos Creator Debugger

Cocos Creator Debugger is similar to the Cocos Creator Devtool mentioned above, however, it doesn’t support Cocos Creator 2.1.x, and hasn’t been updated for a long time. If appropriate, you can download it and try.