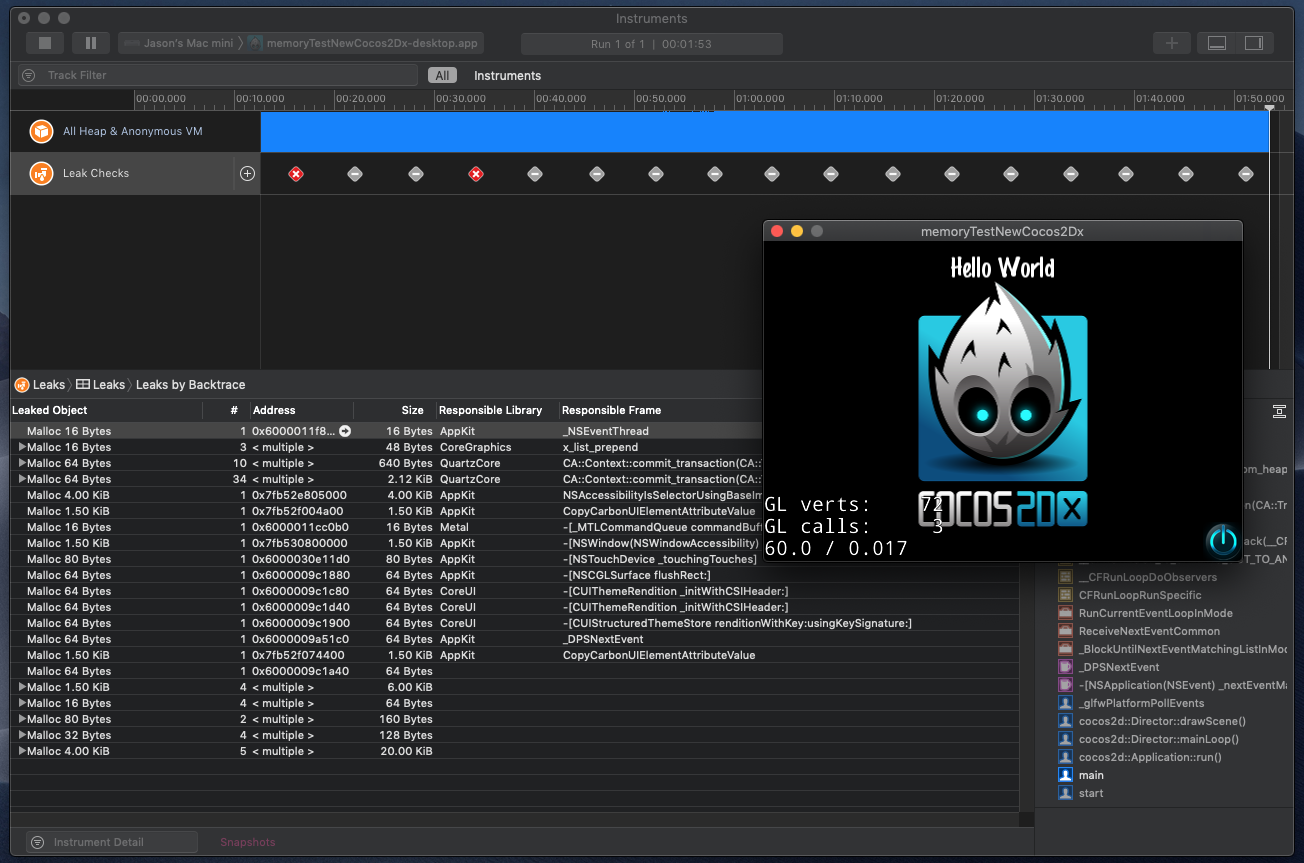
I just downloaded 3.17.1, created a new project and tested for leaks in Instruments. As you can see in the picture, there are leaks. This happened with 3.8 as well. I am having a very hard time diagnosing the source of them. When I add my own memory leaks on top of this, my app will crash in unpredictable ways. I am lost as to what to do. How can these leaks be fixed? Instruments occasionally points me in the right direction, but the best strategy has been to painstakingly remove functionality until a leak disappears and then narrowing it down from there. Please help.
TLDR; Are the memory leaks in a fresh cocos2dx project an issue? How do you fix mysterious memory leaks?
There are leaks. Also, some users reported that a new empty project takes up about 100mb of RAM.
To fix the leaks I think we would need to spend some time looking at each leak and seeing what is being done wrong or what a modern fix would be. It is probably a good idea.
Can you just confirm your OS version, Xcode version, etc?
It is a little concerning that you’re expecting yourself to add memory leaks, don’t you agree? You should be doing what you can to avoid programming in such a way as to inadvertently add such issues in your code. There are many ways to manage this in order to reduce the chance of any memory leaks occurring.
The one I personally follow is relatively straightforward:
1 - Pass references and raw pointers (if you need null checks) to an object, and the receivers only use it but do not own that object, so they should never free it.
2 - The owner of an object should store the object as a smart pointer, preferably a std::unique_ptr. That way you always know who owns it, and there is no way to accidentally pass ownership of a pointer, since you would have to do an explicit std::move() on that smart pointer.
3 - If you want to ensure the object is not deleted while still in use in several places other than where it was created, then use a std::shared_ptr instead of a std::unique_ptr, but if and only if you can track it’s usage.
Ha, yes, my phrasing suggests I plan on memory errors. The reality is that I have a project which is 98% complete and the memory issues already exist. While trying to suss them out, I discovered that even before my first scene loads, there are memory leaks reported in Instruments.
I appreciate the tips. I’ll keep them in mind. Unfortunately my memory issues are very hard to backtrace.
@Apollo18@kerryk Does this memory leak increase over time?
I think it will not increase memory leak over time. @slackmoehrle Did you ask @zhangxm about this?
I am damn sure this was discussed many years back, Its not an issue AFAIK.
I am not able to find that post but found this Ricardo’s reply.
Regarding this 100mb thing on helloworld project was also discussed previously and I am 100% sure there was reply of @walzer in one of the same question.
May be @stevetranby can also give his opinion.
I am just trying to recall if i am not wrong.
@smitpatel88 At this point I am just running the template project and seeing what is happening. I do know that singletons appear as false leaks. My goal is to see if the template project can use any improvements for 3.18 and if the 100mb initial usage can be reduced at all. I’ll discuss with @zhangxm as needed. If other folks have thoughts on this please state them.
I do think that wrapping Sprite objects, for example in a std::shared_ptr might be a good habit to get into and I plan to test this in a project to see. If does involve a change in coding habits for some developers that are not used to this concept, casting, what it means for memory deletion/retention, etc
Yep, many tools report singletons as memory leak, but they are not. We can try to reduce memory usage by carefully reviewing the codes but it may takes much time. You are appreciated if somebody can take a look.
While these may be real leaks, it appears your screenshot shows only framework (Apple’s) code in the call stack. It’s more likely this is memory that is used for the entire duration of an app execution.