I was testing out the preview version and decided to follow this tutorial hosted in this Site
Midway through the tutorial I decided to update from the preview version to the v3.0 official version.
Everything worked fine, but there is a minor freeze whenever we activate a Node with AnimationComponent.
It doesn’t freeze on subsequent activation and deactivation of the Node. Not exactly sure what could be going wrong.
A node’s activation include node’s recursive activation process, and the enable of all components attached to the whole node tree. It’s not necessarily related to the Animation component. A node with animation normally have relatively complex child tree. But freezing a frame is still very strange, which node is causing the freeze exactly ?
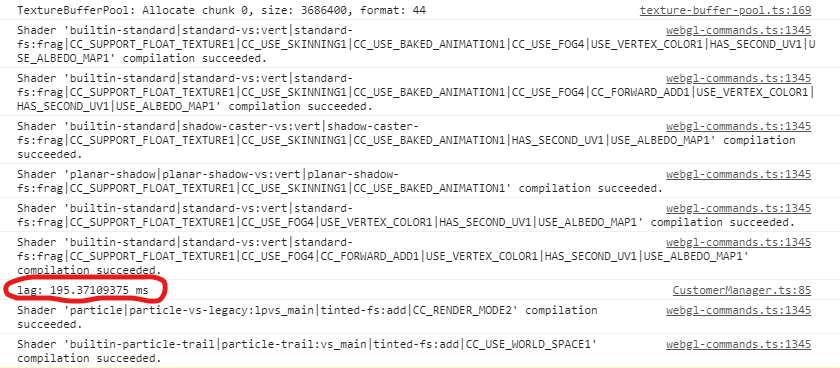
I can see your log is printed during the engine start process, it’s compiling all the necessary shaders, indeed it will take some time.
The log that I have shared in the first post is actually during the gameplay, I assume that when we activate the node with animation component its compiling the shaders. Shouldn’t it be compiled on the initial launch of the game itself.
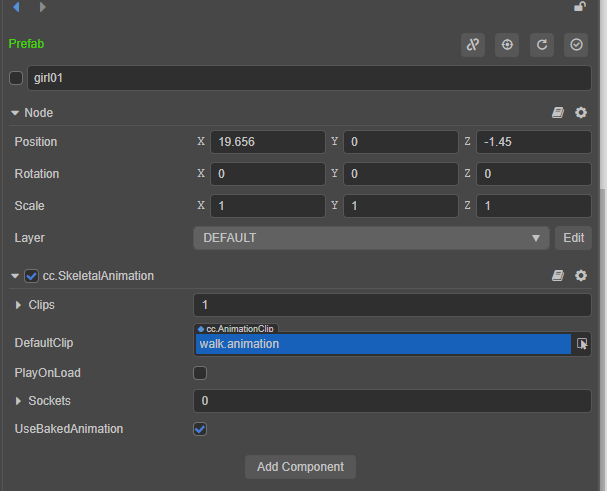
And here is a image of the node and it’s component. It’s inactive by default. It gets activated during gameplay once necessary event has triggered.
In the project files which I have shared: the node is girl01, which is a child of customerManager node
I have added the outcomes of doing the following:-
Node is active by default → Inside onLoad() node is deactivated → Once activated the lag is still 200ms because of compilation of shaders.
Node is active by default → Inside start() node is deactivated → Once activated the lag is around 50ms because of compilation of a few shaders.
I believe it was running fine on the preview build.
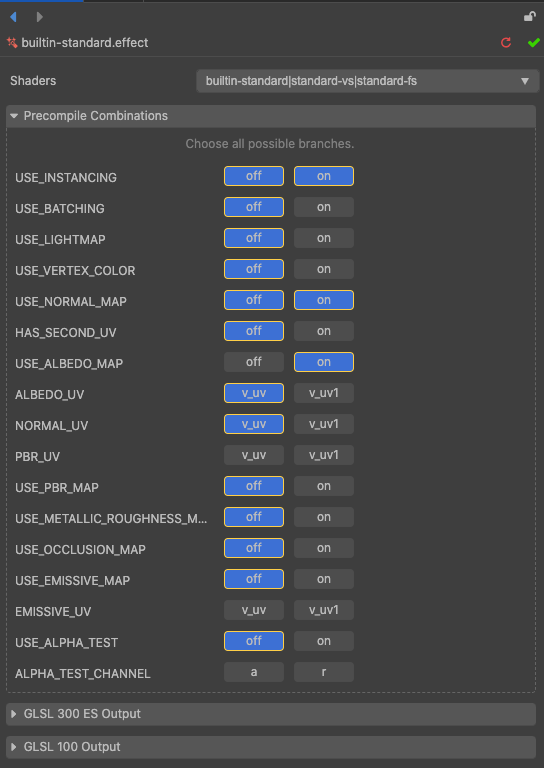
I see, I think it’s because you have several different effect macro combinations, the process is preparing all used shader variations. You can choose the effect you are using (can be located from materials), and in the effect inspector, you can choose some precompile combinations so that it will get precompiled during publish. This should reduce the freeze time shown in the performance record.
For example, the following combination is for builtin standard effect with only albedo and normal map used.
I choose both on/off for USE_INSTANCING and USE_NORMAL_MAP because materials in the project may use or not use instancing batch and normal map. PBR_UV is not activated because none of the materials is using PBR map.
To be noted, if your material is still using a combination that is not covered in the precompiled ones, then we will still compile it at runtime.
The material seems to be locked, since it is imported as a fbx.
So to test I removed the material instance from the property panel of the cc.skinnedMeshRenderer.
Still the game freezes for 90ms, which is close to 5 frames.
So the only way to avoid it right now have the Node active by default and deactivate it in the start().
I also found out that a simple play method on the skeletal animation is taking up 12ms. I have no clue why?. Is there something wrong with my settings which is causing these performance issues?
You don’t need to touch the material, just use it to locate its effect asset, normally it should be builtin standard, but maybe you are using others too, locate all effects you need in the project, and config it for used combinations
Yes, internal assets can not be modified. Skeletal animation has select useBakedAnimation, it will do a Pre-processing when first play and take some time, you can unselect useBakedAnimation when use simple animation clip, there would be no such time consuming.
So do you suggest that I play the animations on start() method so that it gets loaded, to avoid any lag in the game.
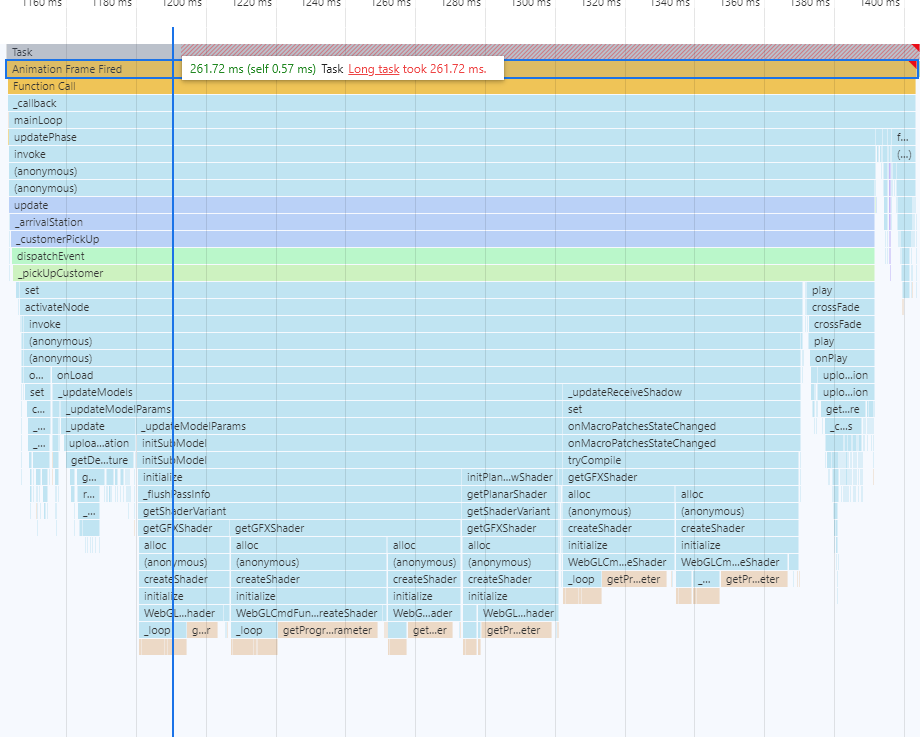
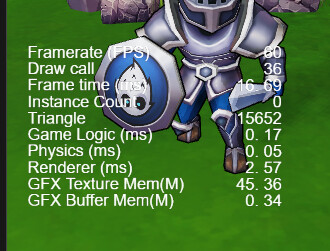
I’m not sure if this is intended but I found it weird the way the Frame time functions in v3.
The frame time is a cumulative of (GameLogic + Physics + Renderer) in ms.
So if you take a look at the following example 0.17+0.05+2.57 = 2.79ms.
But it’s showing 16.69ms.