
@cocosdan You should open the JSB project built by cocos creator.
Thanks for your fast answer.
This mean that I can’t use VSCode to debug ‘directly’ a Cocos Creator project I’m currently editing, I need to build it first?
Right now, when I hit the ‘play’ or ‘refresh’ button, in Cocos Creator, I can view the result of my last changes in the default browser (Firefox), and even debug it if I need to.
I wanted to do the same within VSCode, because it seems the debugger included with VSCode is better than the one of Firefox, but if I need to build the project first, then it is not as interresting as I thought.
Thanks anyway for your help.
–
Daniel
This debugger is used to debug JSB programs, not for h5 apps.
hello, i use it success, but the debug console can’t show any log of the jsb program, how can i config the configuration file?
Debugger uses Firefox remote debugging protocol to communication between client(VSCode) and server(JSB program). There is not a protocol for log information. I will try to implement it if possible.
thanks a lot~
Hi @zhangxm thanks, this looks very promising!
I’m trying out Cocos Creator vs other options at the moment and debug support is really important.
So far, I’ve been able to attach the VS Code JSB debugger to the game running on iOS simulator.
I can run the debugger from the Creator project root folder rather than the jsb build folder, by changing the cwd property in .vscode/launch.json e.g.
{
	"version": "0.2.0",
	"configurations": [
		{
			"name": "Cocos-Debug",
			"type": "cocos",
			"request": "attach",
			"port": 5086,
			"address": "localhost",
			"cwd": "${workspaceRoot}/build/jsb-default"
		}
	]
}
But, when Creator generates the JSB project it minifies all source javascript into a single file project.dev.js (for debug build). There is an option to generate source maps, but can I configure VS Code to use these sourcemaps?
What I want to be able to do is set a breakpoint in the source javascript in assets/Script instead of in the minified project.dev.js
Any ideas, or maybe this is something that is being worked on?
But the JSB project does not have the source javascript, only minified project.dev.js ?
There is an option not to use minified version in Creator.
Great, can you show where that is in Creator? Thanks
@pandemosth currently project.dev.js cannot be tear down to separated files in JSB, because we use node.js require to manage dependencies in Creator project, so we need browserify to package project scripts into project.dev.js. Keeping files apart will cause issues in JSB.
So when native debug is needed, what I do most often is to modify directly in project.dev.js, then apply to original scripts when solution found
Ok, what about source maps then, as this would be the reason to generate them
@zhangxm any plans to support source maps in the VS Code debug extension?
@pandemosth I will take a look. Indeed there is a problem with debugging assets/Script, because i can not find the engine(cocos2d-js) without JSB project. And it will cause problem when the debug step into engine codes.
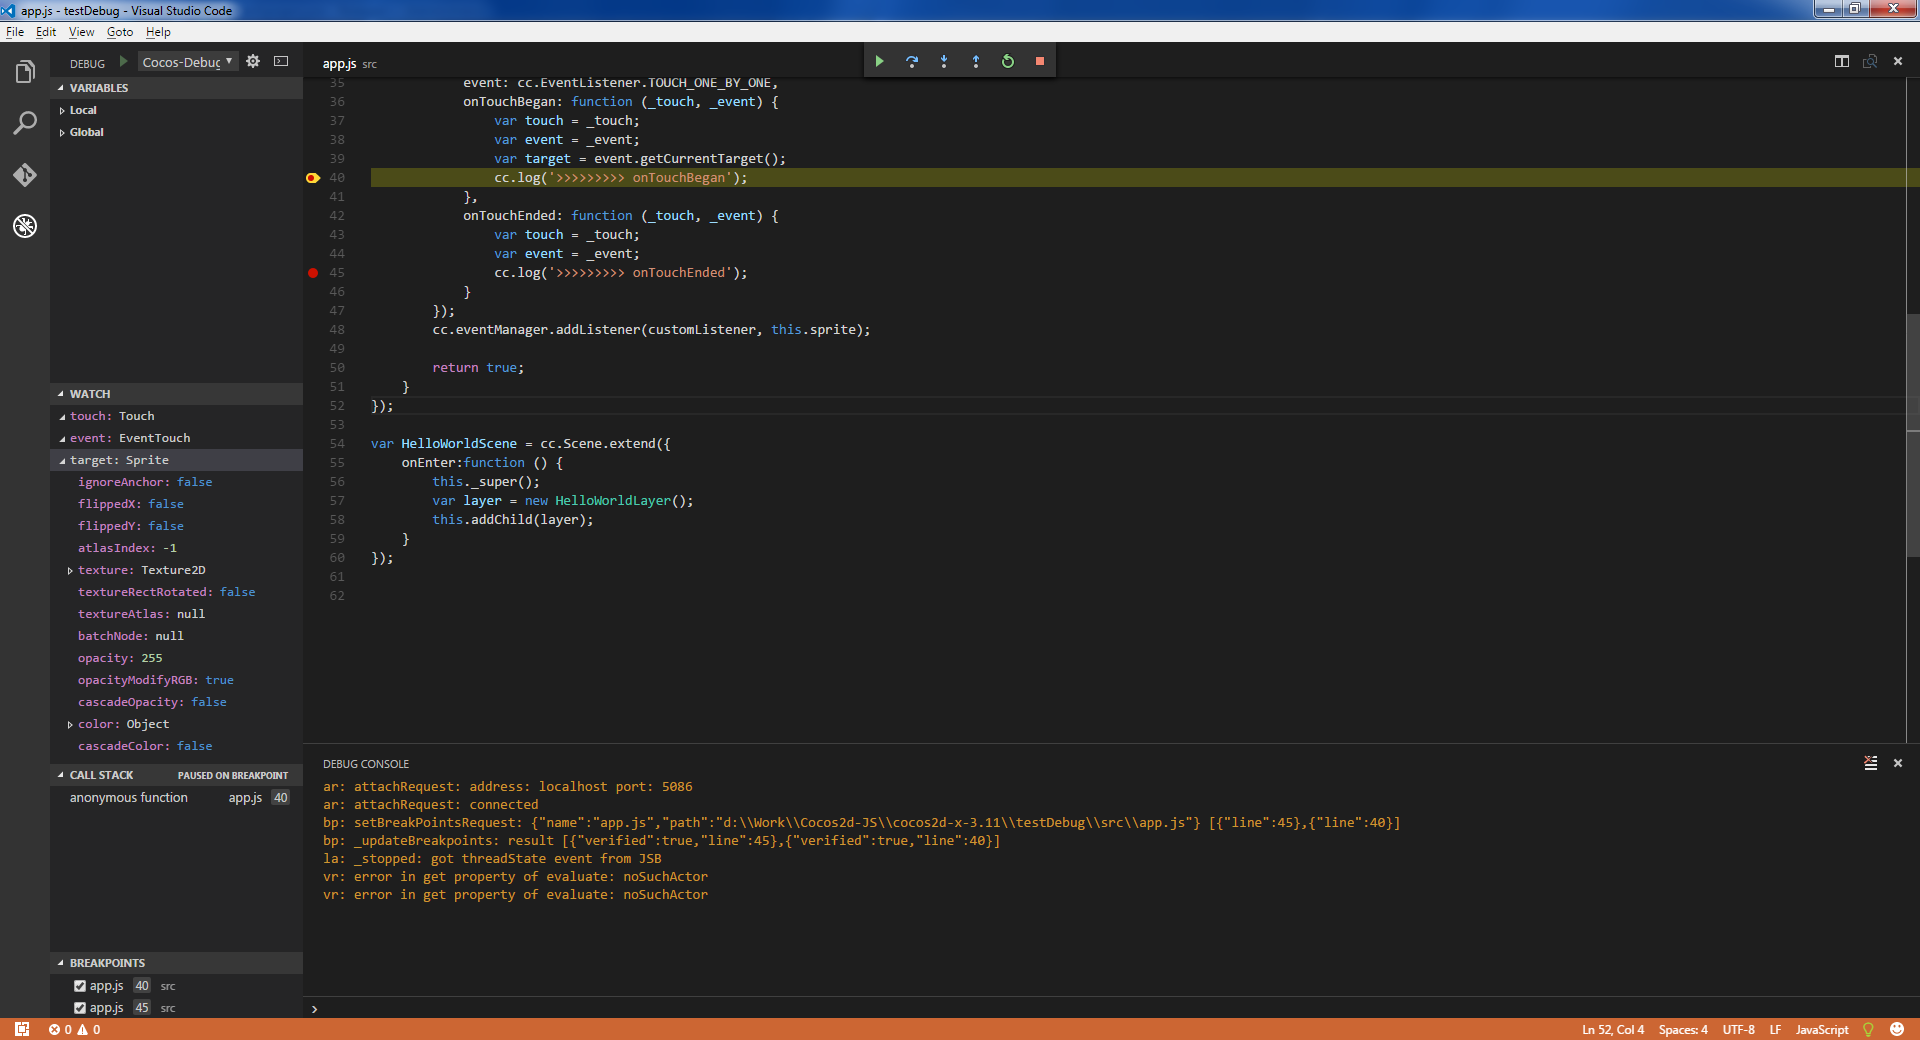
Hi, i created new js project with cocos 3.11 sdk, added test code in app.js
      var customListener = cc.EventListener.create({
            event: cc.EventListener.TOUCH_ONE_BY_ONE,
            onTouchBegan: function (_touch, _event) {
                var touch = _touch;
                var event = _event;
                var target = event.getCurrentTarget();
                cc.log('>>>>>>>>> onTouchBegan');
            },
            onTouchEnded: function (_touch, _event) {
                var touch = _touch;
                var event = _event;
                cc.log('>>>>>>>>> onTouchEnded');
            }
        });
        cc.eventManager.addListener(customListener, this.sprite);
runned it on android device, connected to VSCode debbuger, touched on game field, debugger stopped on breakpoint inside callbacks onTouchBegan or onTouchEnded
As result i can’t see properties of “event” and “touch” parameters and get error in console “vr: error in get property of evaluate: noSuchActor”, but in “target” object shows all fields in WATCH window
What is a reason of this error?
I think it is a bug.
@zhangxm, is it bug in cocos debugger extension for VS Code or in cocos sdk bindings?
What is approximate estimation needed to fix it?